As we’ve discussed previously, business development success leans heavily on the philosophy of nurturing a finite number of important business relationships. This deliberate process will return significantly on investment over time.
To support that philosophy, the CRoPs tiles within ABLE serve to identify those relationships and show a real-time visual trigger of that relationship’s health.
As a quick recap, CRoPs are made up of your top:
- 14 clients
- 10 referral opportunities
- 12 prospects
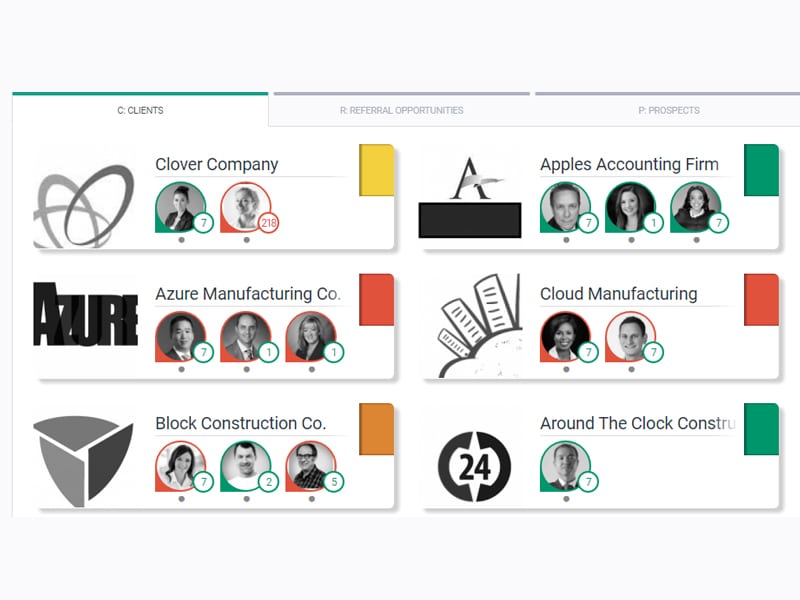
For clients and prospects, each business is represented on a tile within ABLE. And each business can have up to three contacts.
But how do these tiles help business development?
The dashboard indicators reflect the status of your key relationships. This is an average of the interactions you have recorded with each of your contacts. To keep it simple, this indicator will be green, yellow, or red.
How do you keep your tiles green? By recording major and minor interactions with the key contacts.
Major Interactions
Users can configure the appropriate number of major interactions to conduct with each contact over the course of the year. How often these interactions should happen will vary by individual. Some contacts require monthly interactions while others may only require annual touchpoints.
Examples of major interactions might be taking the contact out to dinner or a round of golf. Or it might be something more technical in nature that is provided as a value-add above and beyond the baseline engagement. The goal of a major interaction is to deepen the relationship or provide additional value.
Major interactions are like great artwork: you can’t always define it, but you’ll know it when you see it. If the activity feels like it was enough to be considered major, we encourage clients to define it as such.
Minor Dashboards
Best practices indicate that key contacts should receive a relevant interaction at least every 45 days.
Each contact’s minor dashboard shows your compliance with this recommended approach. The circle color will change from green to red as you go beyond the 45-day “nurture” threshold. The number displayed in the circle is the number of days since your last nurture (minor) activity.
These nurturing touchpoints are the small niceties that elevate and solidify a relationship over time. It might be leaving an after-hours voicemail, sending a birthday or anniversary card, writing a thank-you note, giving a referral, or sending an appropriate article through ABLE’s Thought Leadership tool.
Referral Tiles
Since referrals occur between individuals as opposed to organizations, the referral tiles look different from the client and prospect tiles. Unlike the client and prospect tiles that show the status of an organization made up of multiple contacts, the referral tiles are one-to-one and show your relationship with a specific referral source contact.
Even though they look a little different, the referral tile dashboards work the same way as the contact dashboards.
The final feature of the referral tile is the “scale” icon. To see if your inbound and outbound referrals with a particular contact are in balance, you can access the report that shows all referral activity between the two of you.
Business Development Made Easy
The CRoPs tiles and dashboards help you easily manage your top clients, referral opportunities, and prospects – your 36 CRoPs. By keeping all of your dashboards green, you will solidify your most important client relationships, cultivate your 14 coveted prospects, and maintain balance with your 10 referral opportunities. In the highly billable and production-oriented environment of today’s professional services firm, ABLE allows you to narrow your focus to your 36 most important relationships and keep those CRoPs exactly where they need to be in order to drive long-term success.
Schedule an ABLE demo to see CRoPs in action and learn how this philosophy will grow your business development initatives.